Performance and Status
Current status of investment in environmental safety
Air Quality Preservation Status (Ochang Plant)
Air Quality Preservation Status (Pohang Plant)
Water Quality Preservation Status (Ochang Plant)
Water Quality Preservation Status (Pohang Plant)
EHS Investment Status 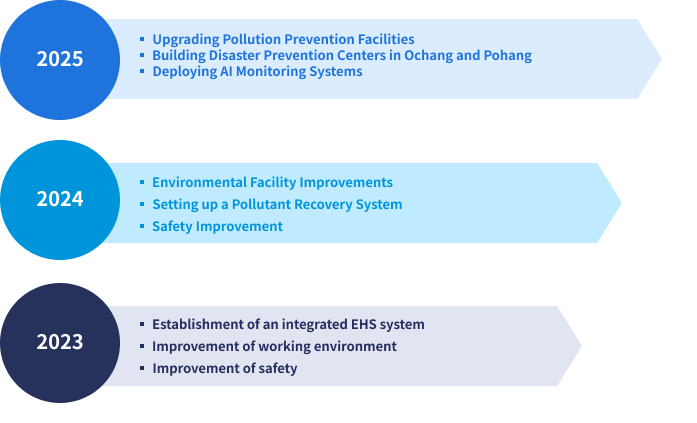
Investment Amount by Year (1M Won)
Energy usage
GHG Emissions
Waste and Recycling
Water usage
* As of 2025
| Type | Unit | Criteria for allowing discharge | Concentration-discharge | Concentration-discharge compared to the allowable discharge standard. |
|---|---|---|---|---|
| Dust | mg/S㎥ | 30 | 2.85 | 10% |
| Nitrogen oxide | ppm | 40 | 11 | 28% |
| Sulfur oxides | ppm | 35 | 0 | 0 |
| Ammonia | mg/S㎥ | 2 | 0.75 | 38% |
| Nickel | ppm | 30 | 0.1 | 0% |
Average 15% less of permitted emissions
* As of 2025
| Type | Unit | Criteria for allowing discharge | Concentration-discharge | Concentration-discharge compared to the allowable discharge standard. |
|---|---|---|---|---|
| Dust | mg/S㎥ | 30 | 0.33 | 1% |
| Nitrogen oxide | ppm | 40 | 24.56 | 61% |
| Sulfur oxides | ppm | 10 | 0 | 0% |
| Nickel | mg/S㎥ | 2 | 0.04 | 2% |
Average 16.0% less of permitted emissions
* As of 2025
| Type | Unit | Criteria for allowing discharge | Concentration-discharge | Concentration-discharge compared to the allowable discharge standard. |
|---|---|---|---|---|
| BOD | ㎎/ℓ | 100 | 1.1 | 1% |
| TOC | 60 | 5.3 | 9% | |
| SS | 100 | 2.0 | 2% |
Average 4% less of permitted emissions
* As of 2025
| Type | Unit | Criteria for allowing discharge | Concentration-discharge | Concentration-discharge compared to the allowable discharge standard. |
|---|---|---|---|---|
| BOD | ㎎/ℓ | 10 | 0.45 | 5% |
| TOC | 25 | 0.2 | 1% | |
| SS | 10 | 0.1 | 1% | |
| T-N | 20 | 0 | 0% | |
| T-P | 2 | 0 | 0% |
※ Application of Water Quality Standards for Public Sewage Treatment Facilities in Pohang
Average 7% less of permitted emissions